
Quantitative Assessments of Remodeling of Fibrillar Collagens in Charcot Neuroarthropathy
Kaitlin L. Saloky, BS, Christopher B. Arena, MD, Kempland C. Walley, MD, Michael C. Aynardi, MD, Thomas Abraham, PhD
The authors report no conflict of interest related to this work.
©2020 by The Orthopaedic Journal at Harvard Medical School
 PDF
PDFBACKGROUND Diabetic Charcot Neuroarthropathy (CNA) of the foot and ankle can have a profound negative impact on patient quality of life and often leads to significant morbidity. Currently, there is a limited understanding of the impact of the disease on fibrillar collagens within the joint synovium. The purpose of this study is to quantify the spatial distribution of fibrillar synovial collagens in diabetic, non-CNA patient controls versus those with Charcot Neuroarthropathy using Second Harmonic Generation microscopy imaging.
METHODS This study used discarded surgical waste synovial tissues from diabetic, neuropathic patients with CNA (n=4) and without CNA (n=4). The tissue sections were then fixed in formalin, embedded in cryo-matrix, and preserved prior to 3D high resolution examination using multiphoton and second harmonic generation microscopy methods. Infrared femto-second laser pulses tuned to 880 nm were used for generating spatially and spectrally resolved 3D images from unstained thick ex vivo synovial tissue sections. The determination of volume fraction of fibrillar collagens, fibrillar collagen density as well as the Fourier analysis to determine the orientation index of fibrillar collagens were performed on these 3D images.
RESULTS Statistically significant differences between CNA and non-CNA synovium fibrillar collagens were observed as decreased volume fraction, collagen fiber density, and the collagen orientation index (all P&l;t0.0001). Synovial Charcot Neuroarthropathy samples demonstrated significant abnormalities of fibrillar collagens within the joint synovium compared to the non-Charcot Neuroarthropathy neuropathic diabetic controls.
CONCLUSION These quantitative and qualitative differences of fibrillar synovium collagens may contribute to progressive joint collapse in CNA.
LEVEL OF EVIDENCE Level II Prospective Comparative Study
KEYWORDSDiabetes, charcot, neuroarthropathy, fibrillar collagens, multiphoton microscopy, second harmonic generation imaging
Diabetic Charcot neuroarthropathy (CNA) of the foot and ankle can have a profound negative impact on patient quality of life and often leads to significant morbidity.1-3 Moreover, the economic burden of disease from a healthcare cost utilization standpoint can be substantial.4 Nearly 30 million Americans are diagnosed with diabetes and up to 5-10% of diabetics with neuropathy reportedly suffer from CNA.5
Charcot neuroarthropathy (CNA) is characterized by rapid bone destruction and surrounding joint collapse often in the absence of infection or trauma.3 Despite immobilization or surgical intervention, the disease is often progressive leading to worsening collapse of the foot and ankle resulting in significant deformity. Though significant research has been performed regarding the pathophysiology of CNA, the pathogenesis of disease is still poorly understood.1-3,6 The acute Charcot process is believed to be triggered by repetitive microtrauma to the insensate joint, which leads to joint instability.1,2,6 This is often combined with neurovascular abnormalities which then produce an amplified vasodilatory response and eventually lead to osteoclastic activation, bone resorption, and joint instability.7
Understanding the pathophysiology of CNA, a complex neuro-musculoskeletal disorder, requires knowledge of collagen cytokine behavior. Type-1 fibrillar collagen, the major structural protein in bone and synovial tissue, releases the carbonyl-terminal telopeptide domain of type-1 collagen (1TCP) when it is naturally degraded which has been used as a marker of bone resorption.8 Carbonyl terminal propeptide of type-1 collagen (P1CP) is normally released during osteoblast activation and is a marker of bone formation.9 As such, an increase in 1TCP relative to P1CP in acute CNA patients indicates excessive osteoclastic activity as a feature of early disease process.10 Moreover, one immunohistochemical study has demonstrated that cytokines induced the osteoclastic bone resorption in the pathophysiology of CNA.3 Still, there is a limited understanding of the disease impact on type-1 fibrillar collagen. Understanding quantitative and qualitative changes within type-1 collagen at the cellular level may be critical to understanding the mechanism of widespread joint destruction and bone resorption in CNA.
Multiphoton and associated microscopy methods, particularly second harmonic generation (SHG), have been widely used for deep tissue imaging of structure and dynamic interactions in biological cells and tissues with submicron resolution.11,12 In addition, these methods have been successfully used to address orthopedic and tendon-related remodeling issues in small animal model studies as well as relevant in-vitro bio-artificial tendon models.13-17 There have been no studies to date using second harmonic generation and multiphoton excitation fluorescence (MPEF) microscopy to evaluate fibrillar collagens in synovial CNA tissue samples. The SHG signals derived from collagen macromolecules strongly depend on the collagen organization and spatial distribution. Herein, SHG was used to detect three-dimensional structural remodeling of fibrillar collagens in human synovium tissues from diabetic neuropathic patients compared to patients with CNA. Our hypothesis is that fibrillar collagens in the synovium of neuropathic patients with CNA will be abnormal when compared to non-Charcot, neuropathic controls.
Preparations of Human Synovium Samples for Imaging
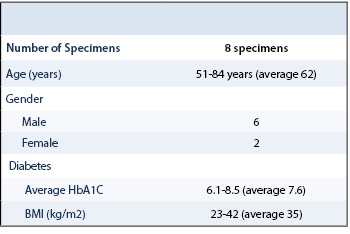
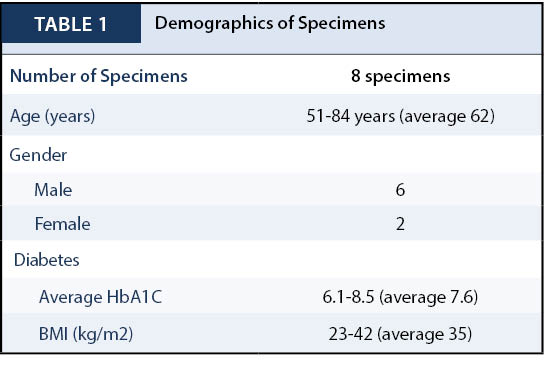
Following approval from our institution’s ethics committee (IRB #00006331), all diabetic patients with neuropathy, as well as those with CNA, undergoing amputation of the foot for non-healing ulceration and osteomyelitis were approached regarding study enrollment. Diabetic patients without neuropathy and patients with Charcot secondary to other etiologies were excluded. A total of 8 patients met enrollment for the study, 4 patients with diabetic CNA and 4 diabetic patients with neuropathy without destructive changes of CNA. Clinical characteristics are shown in Table 1. At the time of amputation, a 3 x 3-millimeter capsular excision was performed from the dorsal capsule of the affected joint and an underlying wedge of synovium was harvested. The synovial sample was not involved in an open wound, a sinus tract, or immediately adjacent to osteomyelitis. Control tissues were harvested from the same location as the experimental counterpart. Tissues from all patients were fixed in formalin, embedded in cryo-matrix, and preserved in -80°C freezer prior to 3D high resolution examination using multiphoton microscopy and harmonic generation microscopy methods.
Multiphoton and SHG Microscopy Methods
Tissue sections were imaged using a Nikon A1 MP+ Multi-Photon Microscope system (Nikon Instruments, New York) to quantify fibrillar collagens in 3D by SHG imaging, as described by Abraham et al.18 As previously demonstrated in our laboratory, one can directly visualize fibrillar collagens without the use of exogenous probes, histological sectioning, or staining by using harmonic generation imaging. Specifically, a mode-locked femto-second Spectra-Physics InSight DS femtosecond single-box laser system with automated dispersion compensation tunable between 680-1300 nanometers (nm) (Spectra-Physics, Mountain View, CA) was used for excitation. The laser output was attenuated using acousto-optic tunable filter (AOTF). As previously described, the power-attenuated laser was led to a Nikon scan head coupled with Nikon upright microscope system (Nikon Instruments, New York). The laser beam was then focused onto each specimen via a high numerical aperture, low magnification, long working-distance, dipping objective lens, CFI75 Apo Water 25X/1.1 LWD 2.0 millimeters (mm) WD specifically designed for deep tissue imaging and other ex vivo / in vivo / in vitro imaging. Image acquisition was accomplished using Nikon Element Software. In the reflection mode, a non-descanned high-sensitivity Gallium arsenide phosphide (GaAsP) was used to collect SHG signal with a bandpass filter 440/20 nm (Chroma Technology, USA). 3D image data was acquired with an excitation beam tuned to 880 nm. First, the beam was focused at the maximum signal intensity focal position within the tissue of interest, and the corresponding gain detector level was then designated to acquire the pixel intensities within the range of 0-4095 (12-bit images) using a color gradient function. Afterwards, the top and the bottom optical sections were designated based on the signal level degradation to define a 3D stack. Then, a series of 2D images were then acquired at 512 x 512 pixels for the selected 3D stack volume. The 3D stack image was captured from tissue with an optical section thickness (z-axis) of approximately 2μm. For each tissue volume described, 2D images were assembled into 3D image using VOLOCITY (Perkin Elmer, UK). Spectral measurement was also performed to confirm the presence of SHG signal originating from fibrillar collagens.
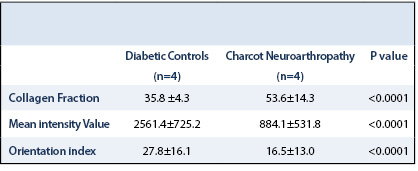
Calculations were performed on the 3D SHG image data sets recorded from a total of 5 different areas using tissue depth of ~300 mm thickness. 3D image volume of tissues generated using similar imaging conditions were then systematically compared (Table 2). To assess statistical significance, student t-tests were used with a P value < 0.05 considered to be statistically significant.
Voxels and voxel intensity
VOLOCITY software (Perkin Elmer, UK) was used to quantify voxels and voxel intensities. A noise removal filter with a kernel size of 3x3 was applied to all 3D image data in addition to baseline thresholding to exclude background voxel values, which has been previously reported. The aggregate sum of all voxels of voxel intensities above this threshold value was quantified and subsequently reported.
Fourier transform image analysis
MATLAB software was used to perform Fourier analysis, as previously described by Abraham et al.17 to convert complex spatial patterns (represented by changes in pixel intensity values) into directionally dependent frequency components. This technique has been used to determine the fiber orientation and anisotropy of the collagen fibers, as previously described.17 Fast Fourier transform (FFT) was performed on each 512 x 512-pixel image to convert it from a spatial domain to frequency domain. The Fourier transform power spectrum generated was then rotated 90° to align the frequency distribution data with the original 2D image. To quantify the degree of orientation of the collagen fibrils along a given angle, an orientation index (OI) was then used. Simply put, an OI of 100% characterizes an image with all fibers aligned along a particular direction, while an OI of 0% characterizes a random alignment.
Imaging of Fibrillar Collagen Matrix Remodeling in Charcot Versus non-Charcot samples
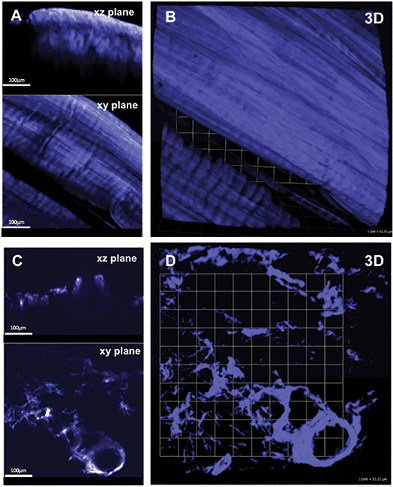
Representative 3D SHG images originating from fibrillar collagens in non-CNA versus CNA cases are shown in Figure 1. Left panel shows the sectional views, and the right panel shows 3D reconstruction representing a ~300µm thick tissue section. The emission spectrum obtained from the wavelength scan reveals a strong SHG signal manifested by a narrow peak at 440 nm, which is exactly one-half of the excitation wavelength (i.e. 880 nm). In CNA cases, the spatially resolved 3D SHG images showed relatively disorganized fibrillar collagens compared to the non-CNA control groups.
Quantification of Collagen Distributions in non-Charcot versus Charcot
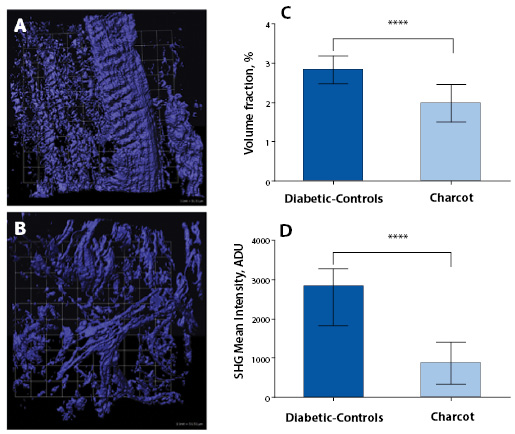
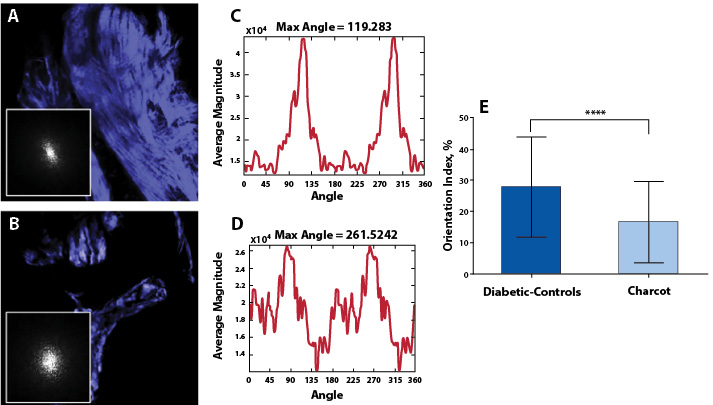
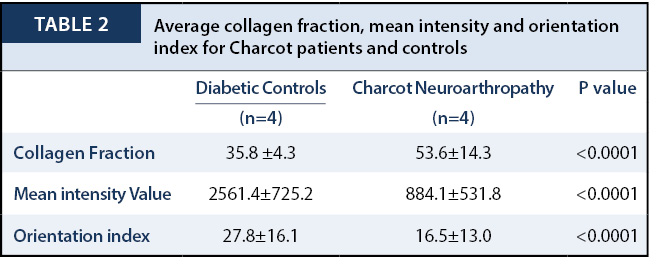
The statistical distributions and quantitative values obtained in the CNA compared to the non-CNA controls are illustrated in Figure 2. Representative SHG images of anisotropic collagen structures above the defined threshold values are characterized in Figure 2A-B. Figure 2C shows that the calculated collagen volume fraction is smaller in the CNA cases than in the non-CNA controls, indicating the destruction of fibrillar collagens in CNA cases (P<0.0001; Table 2). Of note, histograms show a region of overlap due to the heterogeneous nature of the tissues. The computed SHG mean intensity, which characterize the collagen fiber density and the degree of organization, denotes that collagen fibers in the sample studied are statistically more disorganized in CNA cases compared to non-CNA cases (P<0.0001; Table 2).
The results of Fourier analysis of SHG are summarized in Figure 3. The plot of power spectral density (Figure 3D) demonstrate that the high frequency components of SHG signal are condensed at multiple directions, indicating random arrangements of collagen fibers in CNA cases. The mean OI values of collagen fibers were found to be low, corresponding to less order, and their mean numerical values are found to be 16.50±13.04. In contrast, as evidenced from the plot of the power spectral density (Figure 3C), the collagen fibers favor an orientation in one direction rather than random in non-Charcot cases. The computed layer-by-layer OI values were found to be significantly greater (27.75±16.13). Thus, the high frequency component distributions as well as the fiber orientation properties were found to be relatively low in CNA cases compared to non-CNA cases (P<0.0001; Table 2).
Charcot neuroarthropathy (CNA) is a progressively destructive disorder which ultimately results in bone resorption and joint collapse. CNA has been reported to affect up to 5-10% of patients suffering from diabetic peripheral neuropathy, and the complications of collapse and deformity result in soft tissue compromise, ulceration, infection, and possibly amputation.19 Although formidable advances have been made in understanding the basic science and biochemical factors—including cytokine interactions, alterations in vascularity, and synovial changes—that may be relevant in the pathophysiology of CNA, the underlying mechanism of CNA and joint collapse remains uncertain. Type-I collagen accounts for >90% of organic matrix of bone and is a critical structural component of surrounding synovial tissue and fibrillar collagens. Yet, no study to date has evaluated the qualitative and quantitative properties of fibrillar collagens.20 This study is the first to report the changes in synovial tissue collagen in association with CNA when compared to diabetic neuropathic patients. Utilizing similar techniques previously described to provide spatially resolved 3D structural remodeling of collagen matrix with SHG microscopy, we assessed collagen in synovial tissue of patients with CNA and diabetic neuropathic patients without CNA.11,13 Statistically significant differences in collagen volume fraction (P<0.0001), collagen fiber density (P<0.0001), and collagen orientation index (P<0.0001) were found when comparing CNA synovial tissue to non-CNA diabetic controls (Table 2).
Previous studies have demonstrated the roles of altered cytokine expression within synovial tissue and osteoclastic bone resorption. Overexpression of cytokines involved in osteoclast regulation, such as IL-1, IL-6, and TNF-alpha, has been reported in immunohistiologic staining in patients with CNA.3 Likewise, Gough et al. demonstrated disproportionate activity of osteoclasts compared to osteoblasts in serum urine markers.10 Both studies provided insight into the pathophysiology of CAN, as the underlying component of the disease may be related to increased osteoclast activity leading to subsequent bony destruction and collapse.3,10
Alterations in vascularity have also been described in CNA. Edmonds et al. provided insight into the arterial blood flow of neuropathic diabetic feet by finding abnormal blood velocity profiles, increased diastolic blood flow, and increased arteriovenous shunting compared to diabetic controls without neuropathy.7 Blood flow abnormalities, in addition to the increased mechanical pressure on the soft tissues due to collapse, may also play a role in the characteristic wound breakdown seen in CNA.
Synovial changes in CNA have also been evaluated in a recent histologic and basic science investigation by Molligan et al. on the role of fibroblast-like synoviocytes (FLS).21 CNA synovial samples were compared to non-CNA controls with isolation of respective FLS for culture. FLS samples were cultured with tumor necrosis factor (TNF)-alpha and co-cultured with vasoactive intestinal peptide (VIP) and cartilage explants. Histologic samples of Charcot synovium were highly inflammatory, demonstrated increased expression of cadherin-11, and decreased innervation in comparison to non-CNA controls. When activated by TNF-alpha, isolated FLS from CNA synovium depleted proteoglycans from co-cultured cartilage, were more invasive, and had higher expression of ADAMTS4, IL-6, and RANKL. VIP interestingly neutralized the catabolic effect of Charcot FLS on co-cultured cartilage. This study not only emphasized the important role that synovium plays in CNA deformity but also identified potential targeted therapies to prevent or treat destructive processes.
This study is not without limitations. While this is a pilot study, one limitation is the relatively small sample size (n=4 CNA specimen, n=4 diabetic neuropathic control). The number of samples was limited by both patient/specimen availability as well as the labor intensiveness of surgical specimen harvest, preparation, and analysis. Furthermore, obtaining tissue from patients without CNA or diabetes as controls is impractical given the limited indications for lower extremity amputation in this patient population. With these details in mind, a prior power analysis demonstrated adequate power in this pilot study to detect statistically significant differences in the fibrillar collagen volume fraction, fiber density, and fiber orientation index.
In conclusion, the use of SHG microscopy demonstrated a statistically significant reduction in fibrillar collagen volume, fibrillar collagen density, and fibrillar collagen orientation in the CNA group when compared to the diabetic control group. The results of this study underscore an altered morphology of collagen in the synovium of Charcot patients compared to non-Charcot diabetic patients and represent an important initial step in the elucidation of the molecular mechanisms of Charcot arthropathy. Future efforts will be directed towards explaining the pathophysiology of the observed differences in this study in hopes to prevent the bone destruction and joint collapse seen in CNA.


