|
INTRODUCTION
Optimal management strategies for a number
of conditions routinely encountered in orthopaedic practice remain controversial.
The goal of evidence-based medicine is to integrate the best research
evidence with clinical expertise and patient values.
Expected-value decision analysis is an important
methodological tool in that it allows for the quantitative analysis of
decision making under conditions of uncertainty. (1)
The process of decision analysis involves structuring a decision question
into a decision tree, determining outcome probabilities through a systematic
literature review, and determining outcome utilities by surveying patients.
Decision analysis can then be used to determine the optimal decision and
to examine how decision making changes with varying outcome probabilities
and utilities. (1)
Recently, we have applied expected-value decision
analysis to the controversy surrounding management of acute Achilles tendon
rupture - operative repair versus non-operative cast immobilization -
and to the uncertainty surrounding management of the unaffected contralateral
hip after a unilateral slipped capital femoral epiphysis (SCFE) - watchful
waiting versus prophylactic pinning. (2,
3) This paper will use examples from both of these studies to review
the techniques and implications of expected-value decision analysis.
STEP 1: STRUCTURING THE DECISION PROBLEM
The first step in any decision analysis is
to construct a decision tree to structure the decision problem. The decision
tree must represent the decision, any uncertain events, and all of the
possible outcomes. With acute Achilles tendon rupture, the decision tree
consists of one decision point (decision node) of operative vs. non-operative
management, two uncertain points (chance nodes), and ten possible outcomes
(terminal nodes) .
Per convention, utility data is placed to the right of the terminal nodes
and probability data under the terminal nodes.
STEP 2: DETERMINING OUTCOME PROBABILITIES
Outcome probability estimates are determined
by systematic literature review of best-available evidence. This data
is represented on the decision tree beneath each terminal node .
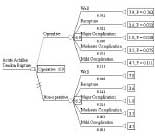 |
Decision
Tree for Acute Achilles Tendon Rupture. Decision nodes are represented
by o, chance nodes are represented by O, and the terminal nodes are
represented by Þ. Expected value for each decision arm
is listed to the right of the chance nodes (O). Optimal decision strategy
and its expected value are listed to the right of the decision node
(o) |
STEP 3: DETERMINING OUTCOME UTILITIES
Outcome utilities are meant to represent the
value of each scenario to the decision-maker. There are a number of techniques
for determining utility. The one we have recently utilized is a visual-analog
scale questionnaire posing scenarios for the different outcomes and asking
subjects to rate these outcomes on a 0-10 scale, where 0 represents the
worst possible medical outcome and 10 represents the best . These utilities are then added to
the decision tree to the right of the terminal nodes .
How would you value the following possible
scenarios after treatment for Achilles
tendon rupture?
0 = worst possible medical outcome for me; 10 = best possible medical
outcome
for me
Place an ¡°X¡± on the line at the appropriate
location
Doing Well #1. No complications. No rerupture. Return to work @ 10.0
weeks.
73% return to same level of athletics. ¡Ý 80% strength
recovery.
0___________________________________________________________________10 |
|
Sample question from utility questionnaire. |
STEP 4: FOLD BACK ANALYSIS
Fold back analysis of the decision tree describes
the process by which the expected value of each decision is calculated.
1 This is done by weighing the utility of each outcome with its probability.
For example, the expected value of operative repair of Achilles tendon
rupture is calculated using the established utilities and probabilities
as follows:
(7.90 * 0.762) + (2.60 * 0.22) + (1.00 * 0.030) + (3.50 * 0.075) + (4.70
* 0.111) = 6.9 The same fold back calculation can be performed for the
non-operative branch of the decision tree, and yields an expected value
of 6.30. Each expected value is represented in a box at the corresponding
chance node .
Rational decision-making favors the decision path with the highest expected
value.
STEP 5: SENSITIVITY ANALYSIS
Sensitivity analysis is used to determine how
decision making is affected by variations in probability or utility values.
1 In the unilateral SCFE decision analysis, the probability of a late
contralateral slip in the previously normal hip was a major driving factor.
3 Therefore, it is illuminating to examine the sensitivity analysis performed
for this variable .
Sensitivity analysis shows that prophylactic pinning is favored when the
probability of a late second slip exceeds 38%. Therefore, the surgeon
can tailor the decision-making process to patients deemed high risk for
a second slip and pin prophylactically when appropriate.
 |
| One-Way
Sensitivity Analysis: Probability of Late Contralateral Slip. The
probability of late contralateral slip is varied on the x-axis. The
lines represent the expected value for the prophylactic pinning and
watchful waiting decisions. |
SUMMARY
In orthopaedic practice the surgeon is commonly
confronted with difficult decisions between various treatment modalities,
each with defined advantages and disadvantages. In these situations, expected-value
decision analysis is an important methodological tool that allows for
the quantitative analysis of decision making under conditions of uncertainty.
(1) The process involves the
creation of a decision tree to structure the decision problem, fold back
analysis to calculate expected value and determine the optimal decision-making
strategy, and sensitivity analysis to determine the effect on decision
making of varying outcome probabilities and utilities.
In conclusion, expected-value decision analysis
may help us better understand the decision process that physicians and
patients face in orthopaedic surgery. The optimal decision for any specific
patient depends not only on the probabilities of the various outcomes,
but also on the utility of these outcomes for the patient. Hence, there
may not be one right therapeutic answer for all patients, but rather the
patient’s preferences should be explored.
is
a Harvard Medical Student.
is
an Instructor in Orthopedic Surgery Harvard Medical School and is Director
of Orthopedic Institute for Clincal Effectiveness, Children’s Hospital.
Address Correspondence to:
Mininder Kocher, MD,
MPH Children’s Hospital
300 Longwood Avenue
Boston, MA 02115
phone: (617) 355-6617
fax: (617) 739-3338
mininder.kocher@tch.harvard.edu
|