Gene Expression Profiling of Osteolytic Lesions Around Total Hip Replacements
Arun Shanbhag, PhD, Mahito Kuwahara, Grant Garrigues, MD, and Harry Rubash, MD
Biomaterials Lab, Massachusetts General Hospital
Introduction
The macrophage response to particulate wear debris initiates
a granulomatous reaction around components of total
joint replacements. The released inflammatory mediators
facilitate osteoclast recruitment, maturation and stimulation
to resorb bony anchors stabilizing the components, leading to
osteolysis or aseptic loosening.
Recent technologies using cDNA microarrays that can
precisely quantify the expression of tens of thousands of genes,
permit a comprehensive overview of the complex cytokine
machinations in the granulomatous tissues. As such they
offer distinct advantages over traditional techniques such
as Northern blots and RNase protection assays. A systems
approach to understanding the biology of osteolysis can also
facilitate the development of targeted therapies to prevent and
treat this important clinical problem. In this ongoing investigation
we used Affymetrix gene chip technology to profile tissue
samples from osteolytic lesions around total hip replacements
(THR) (1).
MATERIALS AND METHODS
Osteolytic tissue samples were collected from patients
(n=31) undergoing revision surgery for aseptic loosening.
Samples were obtained from lesions identified on preoperative
radiographs and immediately flash frozen in liquid nitrogen in
the operating room. In the laboratory, samples were stored
at (-)80oC awaiting RNA extraction. Approximately 1 g of tissue
was homogenized in the presence of 2 mL Trizol reagent
(Invitrogen, Paisley, UK). RNA was extracted using optimized,
and established procedures and additionally cleansed using
Rneasy mini spin columns (Qiagen, Valencia CA).
MICROARRAY PROCEDURE
A cut-off quality of RNA, determined as the ratio of
the absorbance at A260/A280 nm of 1.9 – 2.1 was used.
Additionally, RNA degradation was detected by identifying
ribosomal RNA peaks (Agilent Bioanalyzer, Agilent Inc, Palo
Alto, CA). Since microarrays are quantitative in nature, it is
important to have no RNA degradation in the sample, particularly
because it would not be possible to determine if a selective
RNA degradation was taking place, compromising the findings.
Thus the RNA quality bar is raised much higher than for other
qualitative and semi-quantitative techniques such as Northern
blots and even PCR.
We experienced that even minor delays in flash freezing
samples, like bringing tissues to the laboratory, typically requiring
less than 120 seconds, was a major consideration in causing
RNA degradation. Similarly, harvesting tissue samples using
a heat generating electric cautery caused mRNA degradation.
Samples stored in saline or fixed in formalin or other fixatives
were under no circumstances used for microarray analyses.
Necrotic portions of samples in patients with a long-term
loosening likely also contributed to sub-optimal RNA. Most
samples did not meet these exacting conditions and only n=4
samples with exquisite RNA quality were carried forward for
Affymetrix gene chip analysis.
Double stranded cDNA was synthesized sequentially by first
strand and second strand using established protocols. Labeled
and fragmented cDNA were mixed with control oligonucleotides
and internal controls to create a hybridization cocktail.
A test chip was run to verify sample quality and the hybridization
procedure was repeated with Affymetrix HG-U133A arrays
representing 25,000 genes, representing the vast majority of the
entire human genome (1,2).
DATA ANALYSES
The microarray data was loaded into Resolver, a statistical
data mining database (Rosetta Resolver v4.0, Rosetta
Biosoftware, Seattle, WA), normalized and error estimated.
Gene sequences were annotated using NetAffex (www.affymetrix.
com), Ensmart (www.enembl.org), and the Expression
Analysis Systematic Explorer (EASE) version 1.21 (david.niaid.
nih.gov/david/ease.htm) bioinformatics queries. To attain a
global perspective of the gene expression profile, data from all
4 samples, representing 22,283 sequences for each sample that
were above the noise cutoff, were globally normalized and combined
by calculating mean intensities and p-values. The top
200 most highly expressed sequences, representing the >99th
percentile were tabulated. Each gene function was annotated
using the OMIM database (On-Line Mendelian Inheritance in
Man, www.ncbi.nlm.nih.gov) and sequences were grouped
based on clearly defined genetic or functional similarities.
The raw data was filtered through a series of statistical
cuts. In the initial filter, error-weighed and normalized intensities
were defined as “present” if genes were on all 4 arrays with
all 4 p-values <0.01. All other genes were defined as �absent�. Subsequently, a more stringent Bonferroni�s corrected significance cutoff of p<10-6 was used.
Principal component analysis (PCA), a mathematical methodology
allowing a reduction of the data set matrix to just two
dimensions, was performed to reduce the dimensionality of the
data set and thus determine the minimum gene components
accounting for the greatest sample variability. Hierarchical
clustering and a 4x9 node self-organizing map were further calculated
with the filtered data set to ease identification of related
gene profiles and similarities in tissue samples. Using a variety
of bioinformatics toolkits, genes related to important mediators
were annotated, cross-referenced with GenBank numbers and
Affymetrix sequence codes, and separated into four functional
groupings: inflammation, bone turnover, extra-cellular matrix
turnover, and angiogenesis. A list of potential inflammatory
mediators implicated from our own studies and the aseptic
loosening literature, were compiled and used to query the combined
data set using a global normalization schema (1).
RESULTS
Each microarray contained 26,855 probe sequences and
68 internal controls, representing approximately 13,560 known
genes and about 270 expressed sequence tags (ESTs). ESTs
are RNA transcripts, whose genes have not yet been sequenced
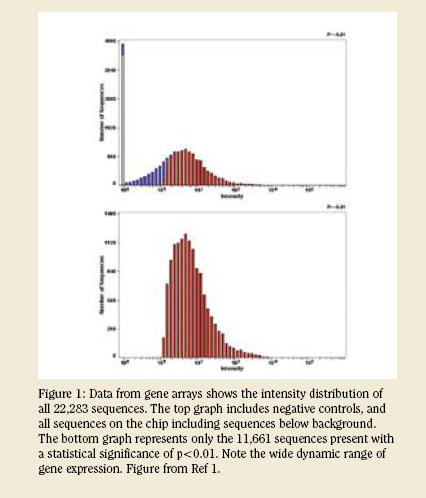
and may encode a functional protein. After an initial screening
utilizing the 68 internal controls, 11,661 genes were considered
“present,” with an intensity range from approximately
10 to 10,000 (Figure 1). After an application of Bonferroni’s
correction at p <1x10⁻⁶, 6,627 genes were identified from the combined array data, representing approximately 25% of the sequences assayed (1). 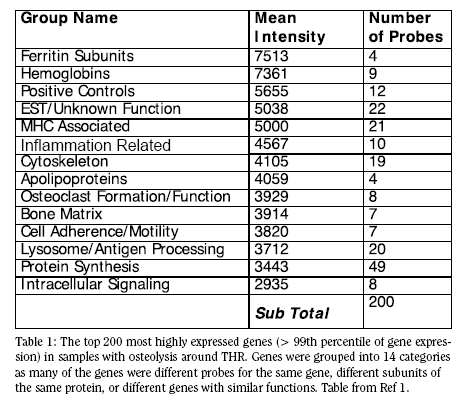
The 200 gene expressions representing the top 1% of the
overall genes on the array were identified for further investigations.
Multiple differing probes for each gene reassuringly had
very similar expression levels. Additionally, genes that are logically
paired and likely to be co-regulated, e.g. different subunits
of the same protein, frequently appeared with nearly matched
expression levels. The top 200 genes clearly and repeatedly
pointed to 14 important functions in the clinical osteolytic
tissues (Table I). Important highlights from this list give us
insight into the majority activity occurring within the clinical
tissues. These include protein synthesis; MHC-associated
expression; lysosome and antigen processing; cytoskeletonassociated
genes.
Principal Component Analysis (PCA )
When dealing with very large microarray data sets, it is
difficult, if not impossible, to discern trends in the data (3).
Further, once a trend in the data set has been captured, it is
pretty straightforward to identify only those handful of genes
which are necessary to mathematically express this trend.
Using PCA, 5,798 genes could be used to express all the variation
in the data sets. Using reduction software, only 21 genes
could describe greater than 90% of the variability of the data
set. It is important to note that while these genes define the
variability of the data-set, they do not necessarily represent key
biochemical pathways in the osteolytic process.
Gene Clust ering and Querying
Clustering permits us to identify genes of interest and others
which share a similar profile. In a clustered data set, any
gene of interest can be picked and genes with similar response
profiles highlighted. Hierarchical and self organizing maps
differ in their treatment of the underlying data and the methodology
of the iterations. In addition to the gene relationships,
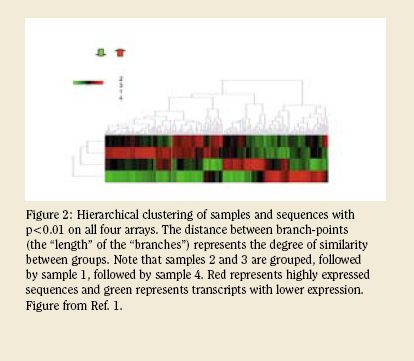
clustering also identifies the similarity between samples. For
example, in the case presented in Figure 2 samples 2 and 3
had very similar profiles, with 1 as the next most similar and 4
as the most different with respect to response gene expression
profile. In a much larger data-set, such a simpler conceptualization
permits us to refer back to patient details to identify
the reasons for such differences pointing to possible causation.
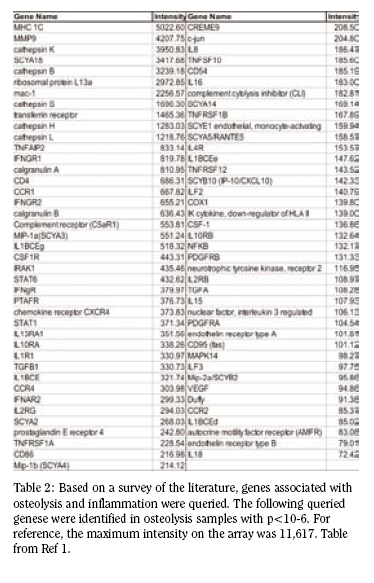
Using our predefined list of genes implicated in osteolysis, and
those potentially involved due to their importance in inflammation,
yielded 81 unique genes with p-values <10-6 (Table 2). In a large sample set, such a list may be further helpful in identifying combinatorial differences in gene expression response under subtly different conditions.
DISCUSSION
In-vitro studies benefit from a highly simplified scenario
of gene expression, usually by a single cell type – the macrophage(
4). As such, gene expression profiles of cell cultures can
be tracked back to specific cell responses already identified in
the literature. In studies using clinical materials, the number of
variables (patient-, device- and technique-associated) increase
exponentially, making interpretations tremendously difficult
but more representative of the clinical scenario. Unlike a cell
culture study, clinical osteolytic tissues are well documented
to include a large variety of cell types including macrophages,
foreign body giant cells and fibroblasts. The close proximity
to remodeling bone and the presence of blood vessels points
to the participation of osteoblasts, endothelial cells and cells
of the hematopoietic lineage. Histological investigations have
also pointed to a small but significant presence of T-cells (5,6).
Thus the gene expression profile of osteolytic tissues includes
not only what a single cell type is expressing, but the integral
expression of all genes of all cells and types present in the
tissue, at the time of its harvest. While an analysis and interpretation
of this data is not easy, it is satisfying to know that
the complex interactions alluded to in the data set are actually
ongoing in the clinical patient at the site of the lesion, and thus
of particular import.
 The analysis of the top 200 genes actively expressed in
interfacial tissues yields a quick glance at the proverbial ‘tip of
the iceberg’ (Table 1). The startling feature of this list is the
presence of a large number of genes (forty one), associated
with putative roles in antigen processing, presentation and its
sequelae. This group largely consists of many MHC (major
histocompatibility complex) proteins, and confirming that the
machinery for macrophage interaction with T and B cells, key
drivers of the adaptive immune response has been activated
(7). Macrophages, sentinels of the immune response, phagocytize
and process antigen, and present it to circulating T-cells
in the context of the MHC proteins to decide if the antigen is
derived from host protein or not. If the antigen is foreign, the
T-cells begin to formulate a antigen specific, adaptive immune
response in close coordination with B-cells. At local sites of
inflammation, as well as at remote sites of immune response
maturation (spleen and lymph nodes), specific responses
include antibody formation and cytotoxic T-lymphocyte activation
to destroy both extracellular and intracellular invaders (7).
Thus expression of genes associated with antigen presentation
is not surprising given the histology of the granuloma and
the presence of these cell types in clinical materials. Further,
in recent studies using protein chips to better identify mediators
present in osteolytic tissues, we have demonstrated the
significant presence of chemotactic factors recruiting activated
T-cells: interferon-?-inducible protein of 10KDa (IP-10) and
monokine induced by interferon-? (MIG) (8). In pilot studies
just completed in the laboratory, we also reported that T-cell costimulators,
CD28, B7-1 and B7-2, all crucial for facilitating and
stabilizing the immunological synapse, are also expressed (9).
The analysis of the top 200 genes actively expressed in
interfacial tissues yields a quick glance at the proverbial ‘tip of
the iceberg’ (Table 1). The startling feature of this list is the
presence of a large number of genes (forty one), associated
with putative roles in antigen processing, presentation and its
sequelae. This group largely consists of many MHC (major
histocompatibility complex) proteins, and confirming that the
machinery for macrophage interaction with T and B cells, key
drivers of the adaptive immune response has been activated
(7). Macrophages, sentinels of the immune response, phagocytize
and process antigen, and present it to circulating T-cells
in the context of the MHC proteins to decide if the antigen is
derived from host protein or not. If the antigen is foreign, the
T-cells begin to formulate a antigen specific, adaptive immune
response in close coordination with B-cells. At local sites of
inflammation, as well as at remote sites of immune response
maturation (spleen and lymph nodes), specific responses
include antibody formation and cytotoxic T-lymphocyte activation
to destroy both extracellular and intracellular invaders (7).
Thus expression of genes associated with antigen presentation
is not surprising given the histology of the granuloma and
the presence of these cell types in clinical materials. Further,
in recent studies using protein chips to better identify mediators
present in osteolytic tissues, we have demonstrated the
significant presence of chemotactic factors recruiting activated
T-cells: interferon-?-inducible protein of 10KDa (IP-10) and
monokine induced by interferon-? (MIG) (8). In pilot studies
just completed in the laboratory, we also reported that T-cell costimulators,
CD28, B7-1 and B7-2, all crucial for facilitating and
stabilizing the immunological synapse, are also expressed (9).
High expression of inflammation-related genes were
expected, considering the macrophage involvement and the
overwhelming findings from in-vitro models. But very few
inflammatory proteins appeared to be upregulated in the gene
expression profile. Rather than a simmering inflammatory
response, the gene expression profile paints a vivid picture of
a spirited T-cell macrophage interaction. Instead of high levels
of interleukin-1 (IL-1) and tumor necrosis factor (TNF-a), we
find early lymphocyte activators and lymphocyte chemotactic
agents. Co-stimulators of a T-cell response are also upregulated.
While the paucity of acute inflammatory mediators in
clinical osteolytic tissues is surprising, it is supported by our
recent studies using high-throughput protein chip analysis. We
reported that as-harvested tissue samples have minimal levels
of IL-1 and TNF-a, while very high levels of T-cell chemotactic
agents such as IP-10 and MIG are present (8). Other findings
in the gene expression were also found to have correlation with
and supported by protein chip investigations. Earlier studies
of osteolytic tissues traditionally cultured samples for up to 72
h before analyzing the supernatants. It is this culture period,
along with the necessary mincing of samples and associated
cellular trauma, that is likely causative of the release of the
acute inflammatory mediators. Tissues associated with a
chronic, long simmering pathology such as osteolysis have
miniscule levels of the acute inflammatory mediators.
SUMMARY
Investigating diseases using cDNA microarrays affords
significant advantages over traditional methods of analyzing
mRNA. Most notably, such a wholistic approach can identify
biochemical molecules, and thus pathways, that were hitherto
unrecognized as playing an important role in the development
and/or progression of the disease. In understanding osteolysis,
we have identified the importance of T-cell chemotactic agents
and associated co-stimulators, but the absence of a full-blown
adaptive immune response. This finding has also been confirmed
using high-throughput protein chips – a technology
that was developed after the success of the gene arrays. A Tcell
mediated macrophage activation is a potent pathway that
results in peri-prosthetic bone resorption. The identification of
a large number of associated molecules also points to potential
targets for therapeutic intervention.
Arun S. Shanbhag Ph.D., MBA is Director of the Biomaterials Lab at Massachusetts General Hospital and Assistant Professor of Orthopedic Surgery at Harvard Medical School.
Mahito Kuwahara is a member of the Biomaterials Lab at Massachusetts General Hospital.
Harry E. Rubash M.D. is Chief of the Orthopedic Department at Massachusetts General Hospital.
Address correspondence to:
Arun Shanbhag, PhD, MBA
GRJ 1115, 55 Fruit St
Boston, MA 02114
References:
- Garrigues GE. Osteolysis and aseptic loosening of joint arthroplasty: Gene expression in cell-biomaterial interactions. Harvard Medical School, Health Sciences Technology Program, 2005.
- Pennisi E. Human genome. A low number wins the GeneSweep Pool. Science 2003; 300(5625):1484.
- Knudsen S. A Biologist’s Guide to Analysis of DNA Microarray Data. New York, NY: John Wiley & Sons, 2002.
- Garrigues GE, Cho DR, Rubash HE, Goldring SR, Herndon JH, Shanbhag AS. Gene expression clustering using self-organizing maps: analysis of the macrophage response to particulate biomaterials. Biomaterials 2005; 26(16):2933-2945.
- Goodman SB, Knoblich G, O’Connor M, Song Y, Huie P, Sibley R. Heterogeneity in cellular and cytokine profiles from multiple samples of tissue surrounding revised hip prostheses. J Biomed Mater Res 1996; 31(3):421-428.
- Al Saffar N, Revell PA. Interleukin-1 production by activated macrophages surrounding loosened orthopaedic implants: a potential role in osteolysis. Br J Rheumatol 1994; 33(4):309-316.
- Abbas AK, Lichtman AH, Pober JS. Cellular and molecular immunology. 4th edition ed. W.B. Saunders Company, 2000.
- Shanbhag AS, Kaufman AM, Agarwal S, Hayata K, Decker J, Kawashima M, Freiberg A, Grills G, Rubash HE. Critical Insights into osteolysis using protein microarrays: The importance of IL-6 and T-cell Activation. Trans Orthop Res Soc 2005; 30:148.
- Kawashima H, Hayata K, Rubash HE, Shanbhag AS. T-cell co-stimulators in osteolysis following THR. Trans Orthop Res Soc 2006; 31:698.
|